Scales of an ordinary graph are often referred as natural scales or arithmetic scales. These graphs, plotted on ordinary or arithmetic graph paper, can only be used to compare absolute changes in values because intervals on arithmetic paper represent equal difference or amounts. Moreover, we are often interested in studying relative changes or ratios, which can be displayed and compared by slope of straight line by plotting logarithms of on an arithmetic paper. In practice, we can make this process easier by using another type of graph paper, called semi-logarithmic paper or ratio paper.
A semi-logarithmic paper has equal intervals on the vertical axis, indicating equal ratios or rate of change. At the same time equal intervals on horizontal axis represent equal differences or amounts of change. Thus the essential feature of a semi-logarithmic chart is that one axis has a logarithmic scale and the other has arithmetic scale.
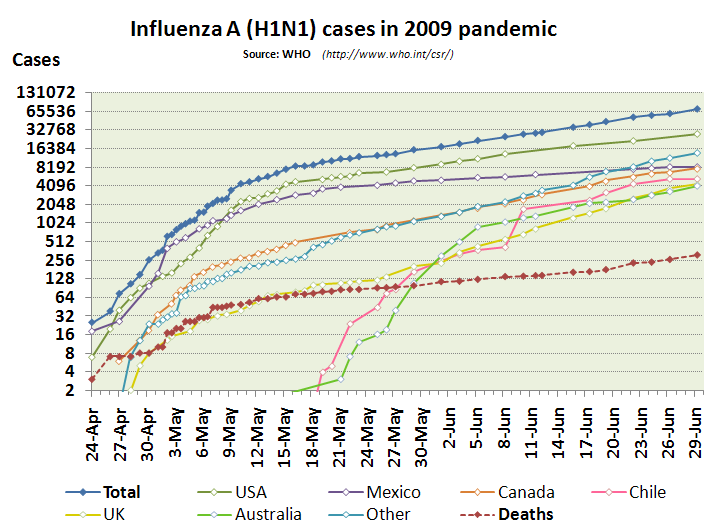
Graphs obtained by plotting values on a semi-logarithmic paper and joining the successive points by means of straight line segments are called semi-logarithmic graphs or ratio charts. They are generally used in following scenarios:
1. to compare relative rates of change
2. to visualize comparisons between two or more series
which differ widely in magnitude.
3. to see whether there is a constant rate of change in the data
A ratio chart has following characteristics:
1. There is no zero line on logarithmic scale as logarithm of zero is minus infinity.
2. A geometric progression when plotted on semi-logarithmic paper forms a straight line as logarithms of a geometric progression forms an arithmetic progression.
3- Slope of logarithmic scale variable indicates rate at which variable is changing.
4- In case of two or more curves, curve with steepest slope will have largest rate of change.
5- Equal slopes (in case of parallel curves) indicate equal rates of change.