Dr. Rizz
I have been thinking about writing up a simplest possible data science example that people can play with, and it gives a taste of predicting something useful. In today’s hot real estate market, I choose the example of freely and openly available Boston Housing dataset available at UC Irvine Machine Learning Repository. The header-less dataset is available for download, and you may download it or copy-paste it into a spreadsheet. Some simple data transformation from text to columns is needed.
As you may see, there are 13 columns or features that are likely to contribute to the price of a house, which is the last column in the dataset. In the interest of simplicity, consider only the number of rooms in a building, which is the sixth column. I choose this column because, the higher the number of rooms, the higher the house price, intuitively speaking. I generate descriptive statistics on the housing feature, and mostly include everyday metrics. Others that require some understanding of frequency distributions and their implications to interpret are left for another time.
Table 1: Descriptive Statistics -- a layman’s view
mean = 15.68
median = 6.32
mode = 100.00
min = 3.56
max = 100.00
range = 96.44
sum = 7933.98
count = 506.00
Generating KPIs are the simplest part of data science, so congratulations on step 1. The number 100 jumps out, as it is also the most frequently occurring stat or mode. Also, personally I have not yet seen a house with 100 rooms. It may represent a special code, and am unable to confirm without looking at the related research paper. Note, how this large value makes the mean and median very different. The median value is a better representative of the typical number of rooms in a house. Data Scientists encounter noisy data all the time, and employ different methods to address the situation, but we’ll pass that for now.
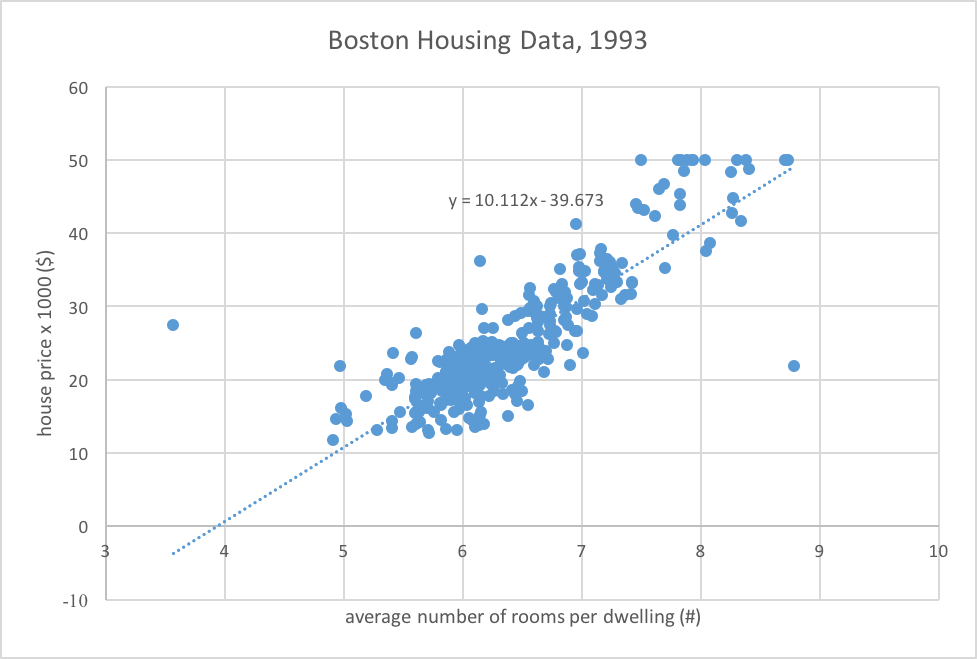
Next, we draw scatter plot of house price (y-axis) versus number of rooms (x-axis). Right-click on the data points, select Linear for Trending Options, Display equation on the chart. This provides a plot with a line of best fit. The line represents a Linear Regression or LR. You can put in the number of rooms as x in the equation to get a prediction on the house price. Voila!!! Your simplistic data science model providing estimates on a house price given number of rooms.
Be mindful, we only selected 1 feature i.e. number of rooms, and ignored the remaining 12 features. Also, we did not address the noise in the data that makes median and mean very different. Further, the dataset was published in 1993. So many years have passed and we likely require fresher data sets. Moreover, there are multiple towns in the dataset, our model only assumes one. The house price provided in the data set are “Median value of owner-occupied homes” – would a rented accommodation be any different, and so on.